
This post is a sort of fusion between two former posts that I realized can do something pretty useful together, I am going to take the simple storage of point data in Google Sheets that you might have read about in Collaborative Mapping With Leaflet And Google Sheets and the simple editing of your web map styles in Maputnik that I displayed in Open Source Workflows: QGIS2Web and 3D Extrusion Maps where we edited the output of QGIS2Web to create a 3D interactive map.
The idea here is you can store your data in Google Sheets (whether you want to have another app update it is up to you) and have an updated version as soon as a user opens or refreshes your site.
TL;DR workflow:
1. Create Google Sheet with data that you DO need to update.
2. Add Google Apps Script simple API to get your updated data in GeoJSON format.
3. Create simple map with the data that you DON'T need to update and a link to your Google Sheets "Layer" in QGIS and export it with QGIS2Web.
4. Edit the sources of the output map (change one line).
5. You now have an interactive web map that gets updated data from Google Sheet whenever it is loaded.
Before we get started, I'll make this clear that this method is meant for Point geometry only. There are ways of doing something similar for lines and polygons, but it requires a lot more writing code. Now let's go through the steps:
1. Creating A Google Sheet With The Data You Need Update
I'll write a quick summary, since I already have a post explaining this, but what you need to create is a Google Sheets file with a sheet that will house your data, you should have columns for X and Y (which should probably be in Longitude and Latitude), and whatever other columns you want to add.
For example, the trees sheet I used in the previous post has the following fields:
1. time - as timestamp of when the point was added
2. type - whatever text a user added, or "unknown" if they didn't write anything
3 & 4. Longitude and latitude
5. show - the script that returns the data uses this to determine whether to send a row back or not. Since my sheet is for collaborative mapping, anyone can add points so I added this column to regulate what goes back to users.

The user who asks for this data using the link we'll create in step 2 will get back a GeoJSON file with attributes for time and type and a geometry built from longitude and latitude.
2. Add Google Apps Script simple API to get your updated data in GeoJSON format
Google Apps Script is a sort of simplified JavaScript that google lets you run to extend the abilities of their services, If you ever installed an extension for Gmail, Google Sheets, Docs, Forms or Slides, You've allowed Apps Script to run on your documents. What we are going to do here, is use Google Apps Script to create a simple API that responds to HTTP GET requests ( so basically a link ) and returns our data in GeoJSON format so it can be read and displayed in QGIS and in web maps.
I described the process in the collaborative mapping post, so we'll go through it fast.
In your sheet, click on Extensions and then click on Apps Script, this will open a new tab.

Next we need to add a new function, and it HAS to be named doGet, it's a reserved name for functions that will respond to HTTP GET requests, meaning we can just get a response back from a link. We ARE going to copy a basic version of this function, when you use it, al you'll have to change is the range of columns you are going to use and set the properties you'll be returning.
This is the code for the function, with comments where you will need to change to fit your own data:
After you finish editing the function to fit your data, click on the blue Deploy button on the top right of the screen (unless your language is right to left, then it might be on the left, but there's still only one big blue button), then click on New Deployment

In the new window select the web app type, give your deployment a name, and make sure anyone can access. If you limit the who has access option you're going to have to set up google authentication which is way out of the scope of this post, so keep it on anyone.

You should now get the URL for your GeoJSON, click or copy it and you'll see your data in GeoJSON format. This is it for step 2.

3. Create simple map for QGIS2Web
Open up QGIS and just add whatever layers you want to have on your web map besides the data from Google Sheets, I just used QuickOSM and used the Urban Map Preset it offers to grab roads and buildings around Rome.
You should remember two things when planning your web map:
1. QGIS2Web saves vector layers in GeoJSON format, which can be larger then the original version of the data, so a good idea is to filter the data to only what is necessary to your users.
2. Some of your users might use mobile data, so you are going to want to keep your layers compact. Relying on XYZ, WMTS or Vector tiles layer basemap will likely speed up your web map as opposed to loading all layers as vector.

I am using these layers only as an example, so it's fine that I'm keeping them as virtual layers, if however you plan on recreating your map from time to time, I recommend saving the layers and obviously the project somewhere safe.
Now Let's add the data from our Sheet. Open the Data Source Manager (Ctrl/Cmd+L) and switch to the Vector tab. Just paste the URL of your Apps script "web app" (what you copied at the last photo of step 2) and click Add. The layer can take a moment to load.
This is a good time to style your layer based on attributes or whatever way you want that will export well using QGIS2Web's Mapbox GL JS export map. For example, I added some points with types of either Olive or Orange around Rome and have only approved some of them. I'll create a rule based symbology using circles of different colors. I'm using circles because they are included by default as part of the MapBox GL JG library and will almost certainly have no rendering issues.

Now I'll export the map using QGIS2Web, make sure you are using MapBox GL JS as the export library (set in the bottom left of the window).

You can use whatever settings you want here, it's a good chance to set up popups, interactions, widget and what have yous. If you have a lot of data, this is also the chance to set the precision, unless you are mapping objects within a room, 6 decimal place should be more than plenty. This gis stackexchange answer and xkcd 2170 should tell you why that 8th decimal place is mostly useless in a web map.
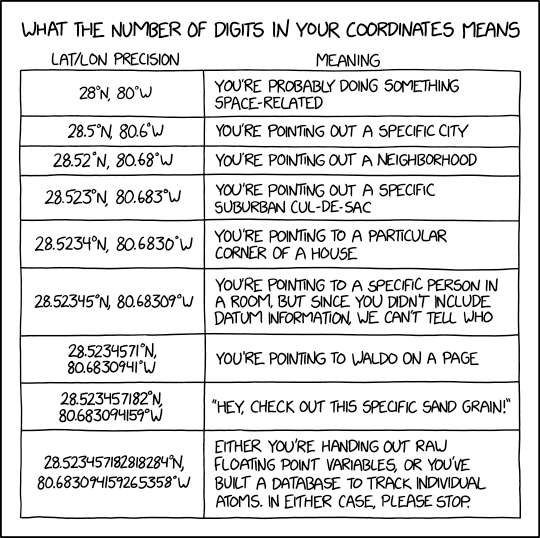 |
| https://xkcd.com/2170/ |
* I had to drop the roads layer because it kept crashing QGIS during exports, since styling other layers isn't the point of this post I'm not going into it, but if somthing like advanced symbology in QGIS2Web exports is important to you, maybe consider sponsoring the developers and at least filing an issue.
Now that we have a working QGIS2Web exported web map, we are done with step 3 and about 98% precent of the way done with creating our always up to date web map.
4. Edit the sources of the output map
Notice that my web map (pictured below) has 2 green points and 1 orange, after we'll perform the change we would be able to just refresh the map and see every new update done in Google Sheets.

We have to open the folder that QGIS2Web exported for you, if you can't find it you can see where it is through the address line at the top of your browser (QGIS2Web opens the map after the export is finished).

Now go to the mapbox folder and use any text editor (i.e. notepad, notepad++, visual studio code etc.) to open the style.js file and replace the name of the data source for your Google Sheets layer from whatever it is (usually json_layer name in lowercase_*, my layer was named "Trees" and was exported second so I got json_trees_2), to the URL of your layer between quotation marks ( " ).
 |
| I changed json_trees_2 to "https://https://script.google.com..." |
Now save the file and reload your map, at first there shouldn't be any changes, since you loaded the data in to QGIS just a few moment ago, but make any addition, edit or subtraction from your sheet and you can see the change whenever the map is refreshed.
In the GIF below you can see I just update values to show/hide trees in Google Sheets and my local map is updated as soon as the refresh hits.

This should be it, you can now deploy this web map on any web server (IIS, Apache Tomcat, Nginx etc.) and you would get your updated map.
If you want to learn about creating a simple collection app to add points from anywhere to your Google Sheet, you can jump back to my previous post about Collaborative Mapping With Leaflet And Google Sheets.
would love the similar post for polygons and line.
ReplyDeleteor should i just export the sahpefile to geojson and deploy it in sheet? while allowing only attribute data manipulation
ReplyDeleteIs this possible also in the Leaflet? I do not see the mapbox in qgis2web, seems like it is not supported nowadays. I searched through all the folders but was not able to find anything similar to "style.js". Is it possible to somehow adjust the code in the "index.html"?
ReplyDeleteI am wondering the same thing as Martin - how to do this with leaflet as Mapbox export is no longer supported in QGIS2web?
ReplyDelete