
I love GeoServer, but styling layers in it can be a pain. In 2017 with version 2.12.0 GeoServer integrated an option for styling using MapBox Styling JSON files, meaning you could style services the same way you'd style vector tiles and layers in MapBox GL JS. Now this is great for a couple of reasons:
1. The conversion of QGIS styling to GeoServer SLD isn't that great, though it is improving
2. GeoServer has no graphical style editor, it's all code, which you could make more comfortable by using the CSS or YSLD plugins, but you still had to write the style without seeing it if you wanted to style your layers (which you do, even if only for performance purposes).
3. While MBStyle JSON files are technically more configuration than code, you could create them with a tool like MapBox Studio or Maputnik (so are SLD, CSS and YSLD but there are no graphical editors for YSLD and CSS and the QGIS conversion of styles to SLD is, again, somewhat lacking).
Now the third point is key to making your life easier, but it holds a certain fault. If you want to create and edit styles in MapBox Studio, you need MapBox Studio to see your service, and that's not always possible. You might be working on a server or data that can't get out of your intranet, or you might just not want MapBox to look at your data.
That is where Maputnik comes in, you can run it locally and query and style your data at ease. Running Maputink out of the box is pretty easy, either by docker or simply running the development version with Node.JS. You can download Mapunik at https://github.com/maputnik/editor or use their online editor at https://maputnik.github.io/editor/.
To use Maputnik effectively to style your GeoServer layers you are going to need 2 extensions, the first MBStyle styling so you could use the styles you are going to create, and the second is the Vector Tiles output format, so that Maputnik can read your data.
Note, that even if you plan on serving raster tiles eventually, styling in Maputnik is for vector tiles and it needs that format to style data effectively. That is for multiple layers, you can always just use GeoJson or served GeoJson and style it there.

Setting up your vector tile service in GeoServer can be as easy as creating a layer group. Since vector tiles are drawn on the client side you don't necessarily have to stack them in the order you want them to display, but it helps to visualize their stacking order mentally.
What I did was stack some Natural Earth layers in an order that works for my purposes, notice that the stack in GeoServer group layers works in reverse, so the the top most layer here (countries) is drawn first and will be below all the others in a raster output format, this is important if you plan to cache raster tiles after styling your data.

After your layers are set up and the bounds are set, you need to head over to the Tile Caching tab and enable the vector tiles output format for the layer group.
I also highlighted the blobstore since you can see it's not the default one, but a XYZ blobstore I set up so that I could distribute my tiles if the need arises, you can check out my guide for setting up a static XYZ cache if you want to learn more about this, but this step is not crucial for serving the tiles, just for saving and redistributing.

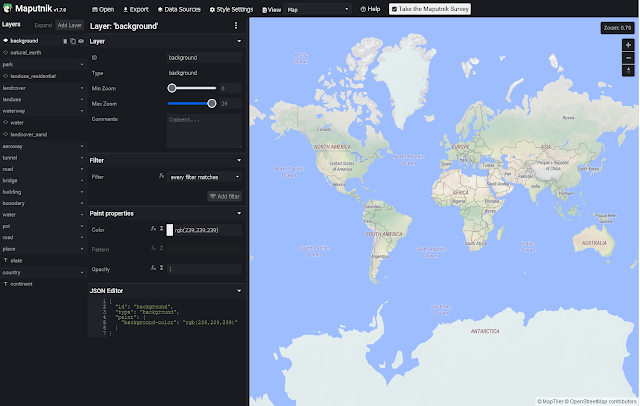
We now have a vector tile service with the layers we want to style, we can open up Maputnik and add it as a source, if you've never opened Maputnik before this is how it should look like when you open it (assuming you are not behind a proxy or using only an internal network).
We first need to open a new empty style and only then add our service as a data source because sources are style specific (for a single JSON configuration file) in MapBox Vector Tiles styling.

Let's add our service as a data source, open the Data Sources menu at the top bar and add a new Vector (XYZ URLs) data source, name it with a name you'll recognize, since I'm using Natural Earth data served from my local GeoServer I'll call mine ne_local, simple and catchy I know.


Now about the tile URL, GeoServer (technically GeoWebCache here) has an unusual way of styling XYZ URLs but it can be pretty simple when you know what you are looking for (and that's what this guide is for) let's build our URL in parts:
1. The server we are asking for tiles, in this case localhost or 127.0.0.1 meaning my computer, note that if you are using tile from a distant server your protocol will most likely be https and not http, there's a difference.
2. The Port GeoServer is served on, by default 8080, is split from the server name/address by a colon (:)
3. The GeoServer inner address for a WMTS service, by default it will be /geoserver/gwc/service/wmts
4. Now we into URL parameters, which are split from the server address by a question mark (?) they are divided from one another by an Ampersand (&)
4.1 What service are we querying? SERVICE=WMTS
4.2 What are we asking from the service? REQUEST=GetTile
4.3 What Version of the service (you can see which version are available in the GeoServer
main page)? VERSION=1.0.0
4.4 What layer are we asking for (this can a layer group)? this is split into wokrspace:layer by a colon. In my case the workspace and the layer group are both call natural_earth so my parameter
is: LAYER=natural_earth:natural_earth
4.5 What coordinate system are we querying tiles in? by default Mapunik as well as most web
mapping libraries use web mercator/google mercator which are represented by EPSG codes
900913/3857. The parameter is named tile matrix set and looks like this:
TILEMATRIXSET=EPSG:900913
4.6 What is our zoom level in the tiled CRS? TILEMATRIX=EPSG:900913:{z}
Note that is the first coordinate we are letting Maputnik fill in by using curly brackets around
the letter z
4.7 What is our the tile's X location? (Note these are not coordinates, but tile positions)
TILECOL={x}
4.8 What is our tile's Y location? TILEROW={y}
4.9 And last but not least, what is the format we want tiles in? This can be an image format,
or even GeoJSON but in this case we want vector tile and the parameter should look like this:
FORMAT=application/vnd.mapbox-vector-tile
My address looks like this, yours will include your layers and server name obviously but most parameters should remain the same.
http://localhost:8080/geoserver/gwc/service/wmts?SERVICE=WMTS&REQUEST=GetTile&VERSION=1.0.0&LAYER=natural_earth:natural_earth&TILEMATRIXSET=EPSG:900913&TILEMATRIX=EPSG:900913:{z}&FORMAT=application/vnd.mapbox-vector-tile&TILECOL={x}&TILEROW={y}
Once the source is added you should see it pop up into the Active Sources box

Let's get styling, I'm not going to explain everything about Maputnik, just the very basics, but it is relatively intuitive and you can always ask questions in GIS Stackexchange, the Maputnik repository's issues, or down here in the comments.
First thing we'll do is add a layer, I like to start with adding a custom background, but it's both not important, and GeoServer doesn't like background layers, so lets add a layer from our source, I'll start with the countries layer from Natural Earth. Since it's a polygon layer I'll add it as a fill layer type, but MapBox styling also supports adding polygon layers as lines, in fact that is the only way to display stroke effects for polygon, by adding them again as a line layer.


I'll give my new layer a name, select the type, and the source and now we come into something a bit annoying with Maputnik, it can't guess or give us a dropdown choice for the layer name, for that I'll have to go back to GeoServer and make sure I have the exact name for the layer I want to use.


We should now have our first layer up, we can keep adding more and more sources, just don't freak out if you can't see the sources added on top of each other, the default color for every new layer is black. We can change all the style options for our layers in the side panel and if we want different styling for different zoom levels we can duplicate a layer (or add a new copy of it).
For the more complicated styling options you'll probably need to refer to either the MapBox or MapLibre styling guides and examples and adjust the configuration at the bottom of the panel, but for most simple styling you could probably figure it out inside the panel by playing around with it.
For example I've had to change the code so that countries in Africa are shown in pink while everything else is shown in black, this was the expression I used:
"match",["get", "continent"],
"Africa",
"#ff003d",
"#000"
]
Note that all of the text is in double qoutes, that is because Maputnik doesn't like single qoutes for some reason, but they may appear in the examples you see on the MapBox and MapLibre sites.

When you are done styling your layers, you can download the style JSON file by clicking Export and then Download Style, save the JSON file somewhere you can easily find it. Note that you can also download an HTML version that simply displays the layers you just styled, if your data sources are for an external server ( meaning not localhost) you can even share that map as a file (or served via Tomcat, IIS or any web server) with everyone that can access the data source.


We now have to open up GeoServer and create a new style with the MBStyle format and simply load your JSON into GeoServer. If you did use a background layer in Maputnik, make sure to edit it out now and then try to validate the style.


It's important to remeber that these styles can be handy even if you want to filter some features out while serving vector tiles, they are an easy way to control displaying specific features at specific zoom levels and keeping your output data small while serving data.
The layer group from the last image contains only the style shown in Maputink in the first image, it includes Natural Earth Countries, rivers and lakes centerlines, lakes, roads ×2, railroads and populated places ×2. Different layers are shown at different zoom levels and there is no background because GeoServer does not support it as a layer type.

Comments
Post a Comment