
MapLibre has a few caveats that can annoy developers who are used to a different way of working (most, if not all were inherited from MapBox).
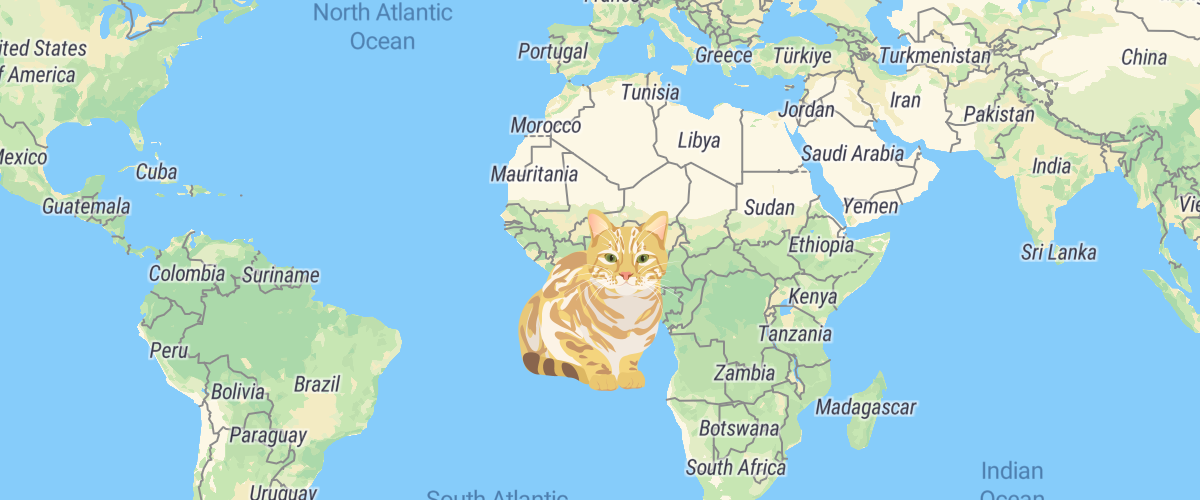
One of these, is the inability to add a point layer with the default marker (seen right below here) as its symbol.
So if you want to add an entire point layer with a pin marker, you would need to create an image from that marker (*waves hands*) somehow, for every way you would want to display your data.
And that's a shame, since the default marker not only looks good, but is also really versatile, you can change its color, scale, opacity, rotation, where is it anchored in regards to the point and a few other nice settings which are helpful when you work with just one point (like the marker is intended for use).
Some of you are asking right now, what is wrong with that, you might have started your web mapping journey like me with Leaflet.js(❤️) and might also recognize this issue from the Leaflet example which adds new custom leaf markers.
You would probably also say, that there is something easier with the MapLibre way of doing things (and we're about to see how much easier it can get).
Doing some work on a system I've developing, I got curious about where is the SVG for default marker. I knew it had to be a vector graphic, because of how dynamic it is (easier to color a vector by parameter than re-color a png image).
This led me to actually read the MapLibre Marker code, which I found similar to a class I wrote for my system.
My class was similar, but had a slight difference with how the SVG was created (almost identical, but no facepalm yet).
This was both good and bad for me, it meant I could use the MapLibre default marker to create any marker symbology I wanted. It also meant, I should have read that code and modified it for my purposes about a month and a half ago and lost a couple of days of works re-developing an existing method.
But enough about me, you want to know why all of this is useful.
We now know that the MapLibre Marker class creates a new colored, scaled etc vector. We also know (let's assume prior knowledge here instead of taking up more electronic parchment) that SVG graphics can be turned into images, both when you draw them into a HTML canvas and when you add it as a source to a HTML image element (💡 image element you say, *rubs chin*).
Let's take a quick detour and look at the MapLibre map.addImage function parameters, this is the function we need to add images which our map context can use for symbol layers (You can see it in the Add an icon to the map example).
The function (along with extra options) takes an ID and an image, but the term *image* here can be pretty broad. We can add an image we loaded (using *map.loadImage* first, like in the example) from a URL, we can use a HTMLImageElement (an <img> tag in our HTML) we already created, we can also use an ImageBitmap, an ImageData, or an object with {width, height, UInt8Array/Uint8ClampedArray (an array of data of colors to draw in each band of each pixel) } or create your own type of image with a StyleImageInterface (an object or class that tells MapLibre how to render your image, you can check out the great animated icon example to understand this one). That is a very broad way of understanding images, which is great for us, if you check out some of the examples regarding images in the MapLibre docs, you could find two that create images out of thin air (or math).
You can also use an image from a spritesheet (which is the best method for basemaps, and probably best for other layers too if you can set it up easily), but that's going way out our way.
So now that we know all of that, we can check what will be our best way of creating a marker as an image that MapLibre can use for a symbol layer.
Let's start with a simple map, this will be our HTML:
So now that we know all of that, we can check what will be our best way of creating a marker as an image that MapLibre can use for a symbol layer.
Let's start with a simple map, this will be our HTML:
<!DOCTYPE html>
<html lang="en">
<head>
<meta charset="utf-8" />
<title>Marker Layer</title>
<meta name="viewport" content="initial-scale=1,maximum-scale=1,user-scalable=no" />
<script src="https://unpkg.com/maplibre-gl@2.4.0/dist/maplibre-gl.js"></script>
<link href="https://unpkg.com/maplibre-gl@2.4.0/dist/maplibre-gl.css" rel="stylesheet" />
<style>
body { margin: 0; padding: 0; }
#map { position: absolute; top: 0; bottom: 0; width: 100%; }
</style>
</head>
<body>
<div id="map">
<script src="index.js"></script>
</div>
</body>
</html>
The HTML (and CSS) only loads the MapLibre library and defines the map to use the whole page.
And here is the start of our index.js file:
let style = {
'version': 8,
'sources': {
'raster-tiles': {
'type': 'raster',
'tiles': ['https://tile.openstreetmap.org/{z}/{x}/{y}.png'],
'tileSize': 256,
'attribution':'© <a href="https://www.openstreetmap.org/copyright">OpenStreetMap</a> contributors'
},
"25_day_1": {
"type": "geojson",
"data": "https://earthquake.usgs.gov/earthquakes/feed/v1.0/summary/2.5_day.geojson"
}
},
'layers': [
{
'id': 'simple-tiles',
'type': 'raster',
'source': 'raster-tiles',
'minzoom': 0,
'maxzoom': 22
}
]
}
let map = new maplibregl.Map({
container: 'map',
zoom:0,
style:style
});
I started by creating the map with just the OSM basemap added.
What I'm going to do now, is add to the Map class a simple function that allows adding a marker as a symbol image to map context. I'm adding it to the Map class, so it can be used with whatever map I create (i.e. if I want to use my script to create multiple maps).
The function takes 3 parameters, ID (the name we will assign to the image in the map context), options (which are just MapLibre Marker parameter), and a callback function (in case you want to use one).
maplibregl.Map.prototype.addMarkerImage = function(id ,options={},callback){
try {
let marker = new maplibregl.Marker(options);
let svgDoc;
if (!options || !options.element) {
svgDoc = marker._element.firstChild;// default marker
}else{
svgDoc = marker._element; // for SVG elements
}
let markerSVG = new XMLSerializer().serializeToString(svgDoc);
let markerImg = new Image(svgDoc.width.baseVal.value,svgDoc.height.baseVal.value);
markerImg.src = 'data:image/svg+xml;base64,' + window.btoa(markerSVG);
markerImg.decode()
.then(() => {
if (!this.hasImage(id)) this.addImage(id,markerImg);
if(callback){
callback()
}
})
.catch((encodingError) => {
console.error("Image Encoding Error")
console.error(encodingError)
});
} catch (error) {
console.error(error)
}
}
Let's go over what the function does, it starts with creating a Marker with the options we passed.
If one of the options is to use a different element it makes sure that that the correct chile of the marker will be used. (this allows us to use other svg and HTML elements, which is great but not the point of this post, and might not work with all element types, but I did test it with other SVG elements and it worked great).
Once we have the marker and it's inner SVG, we can use the XMLSerializer to convert the SVG element to a string. We also use the size of the SVG to construct an image in the right size of what we want (this has to be done before we actually draw something in the image).
We then add the SVG string as the source for the image and use HTMLImageElement.decode which returns a promise that resolves when the image is ready to be added (This drove me mad until I found it, without this function the process might not work because the image is not ready to be added to the map).
Once all of this is done, the image is added with the ID to the map context and if there is a callback function (this can used for adding a lot of images before creating your layer) and that's it.
Once we have this function we can use it to add images very easily and use them for every symbol layer we have, for example:
map.on('load', function () {
map.addMarkerImage('marker')
map.addLayer({
'id': 'earthquakes',
'type': 'symbol',
'source': '25_day_1',
'layout': {
'icon-image': 'marker',
'icon-size': 1,
'icon-allow-overlap':true
}
});
});
Now when the map is loaded, we'll get the USGS layer and see it drawn with the default markers (like we see in the image in the start of the post)
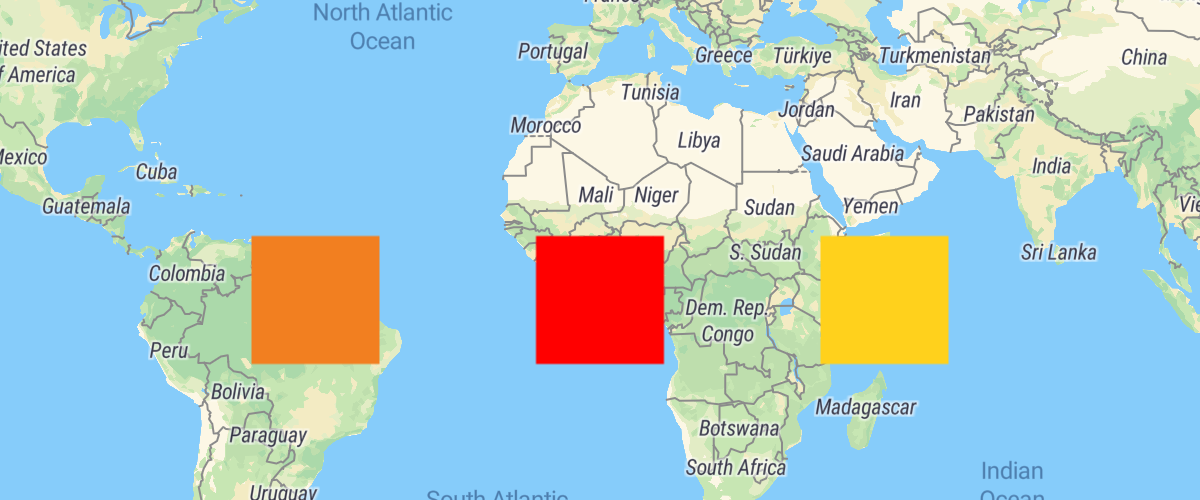
We can add multiple images this way and add other relevant options to it (for example, anchor the image to "bottom" so that the base of the pin will mark the geometry and not the middle of it) and use it in more complex symbology.
In the following example I added 5 marker images (default, small yellow, medium orange, large red, very large balck) and created a case expression with them.
map.on('load', function () {
map.addMarkerImage('marker')
map.addMarkerImage('yellow-marker', {'anchor': 'bottom', 'scale':0.7, 'color':'yellow'} )
map.addMarkerImage('orange-marker', {'anchor': 'bottom', 'scale':1.5, 'color':'orange'} )
map.addMarkerImage('red-marker', {'anchor': 'bottom', 'scale':2, 'color':'red'} )
map.addMarkerImage('black-marker', {'anchor': 'bottom', 'scale':3, 'color':'black'} )
map.addLayer({
'id': 'earthquakes',
'type': 'symbol',
'source': '25_day_1',
'layout': {
'icon-image': ['case',
['all', ['>=', ['get', 'mag'], 2], ['<', ['get', 'mag'], 3]],
'yellow-marker',
['all', ['>=', ['get', 'mag'], 3], ['<', ['get', 'mag'], 4]],
'orange-marker',
['all', ['>=', ['get', 'mag'], 4], ['<', ['get', 'mag'], 5]],
'red-marker',
['>=', ['get', 'mag'], 5],
'black-marker',
'marker'
],
'icon-size': 1,
'icon-allow-overlap':true
}
});
});
You will get this map with default marker as a fallback if any magnitude doesn't fit our expression.

The full code for this example (along with the function) can be found in a repository at https://github.com/bogind/maplibre_addMarkerImage
Any feedback on this either in comments here or issues at the repository is very welcome and I hope some of you find this helpful.
Comments
Post a Comment